QuickWrap
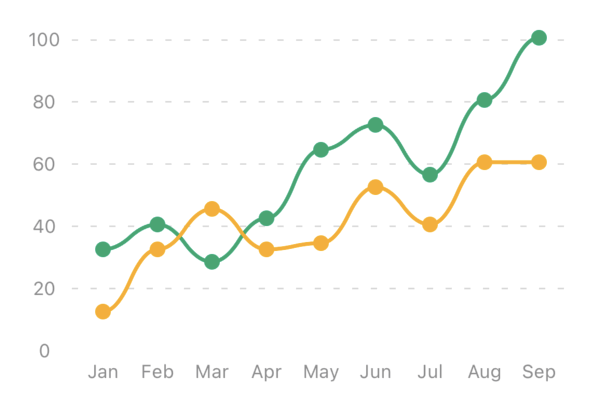
Charts > Line Chart
Page.tsx
Best for tracking changes over time, making it ideal for stock prices, app user growth, or temperature trends. If you want to see patterns, peaks, and dips clearly, this is the chart for you. It helps in making predictions based on past data!